Wisconsin Early Voting Absentee Data on Nov 1st, 2020 as compared to 2000 through 2020 General Election Votes
Comparing the Early voting data as compared to the 2020 General Election Democrat and Republican votes data based on the county based on on Nov 1st 2020 data published.
Mail-in Ballots Count - Battle Ground States
Here is the latest list of the Battle Ground States Early Mail in Votes count. --------------------------------------------------------------------------------
Number of Counties won by Republican Presidential candidates from 2000 - 2016
The number of counties won by Democrat & Republican presidential candidates in key 2020 battle ground states since 2000 to 2016 presidential general elections gives insight into the effort needed by each party to win the elections. Based on the data the Democrats almost always just need to win 1/5th the number of counties to carry the elections like in 2008 and 2012, while the Republicans have to put an effort to win 5/6th's of the county. --------------------------------------------------
Number of Counties won by Democrats from 2000-2016 in Battle Ground States
Democrat County Win Count since 2000 in IA, MI,MN,NC,PA,WI

2016 North Carolina General Election Story (Senate)
Richard M. Burr received 2.4M (51.1 %) votes, beating Deborah Ross who gained 2.1M (45.4 %) by 267.2k votes in North Carolina.
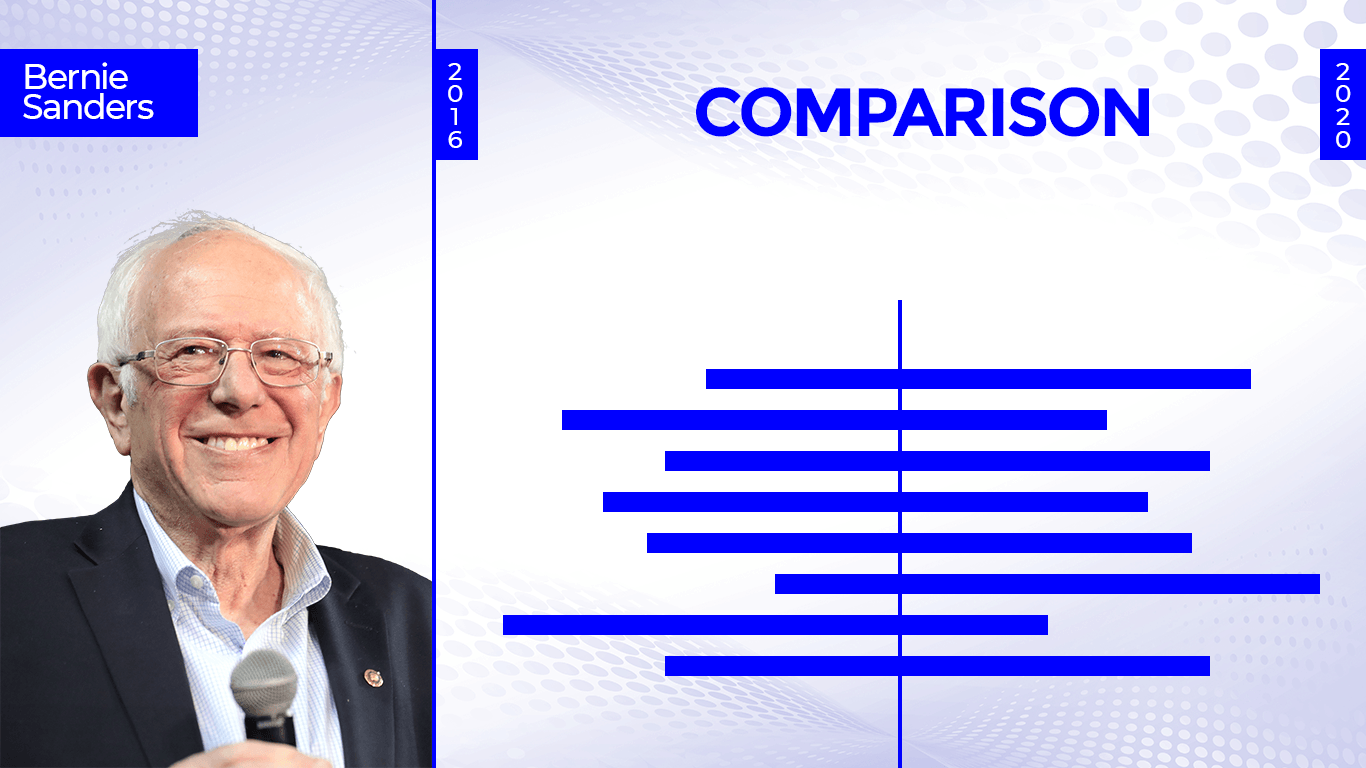
2016 vs 2020 Senator Bernie Sanders Head to Head Comparison
Senator Sanders Senator Bernie Sanders in 34 states got less votes than in 2016 (12,780,624) than 2020 (9,787,836) getting close to 3M (2,992,788)
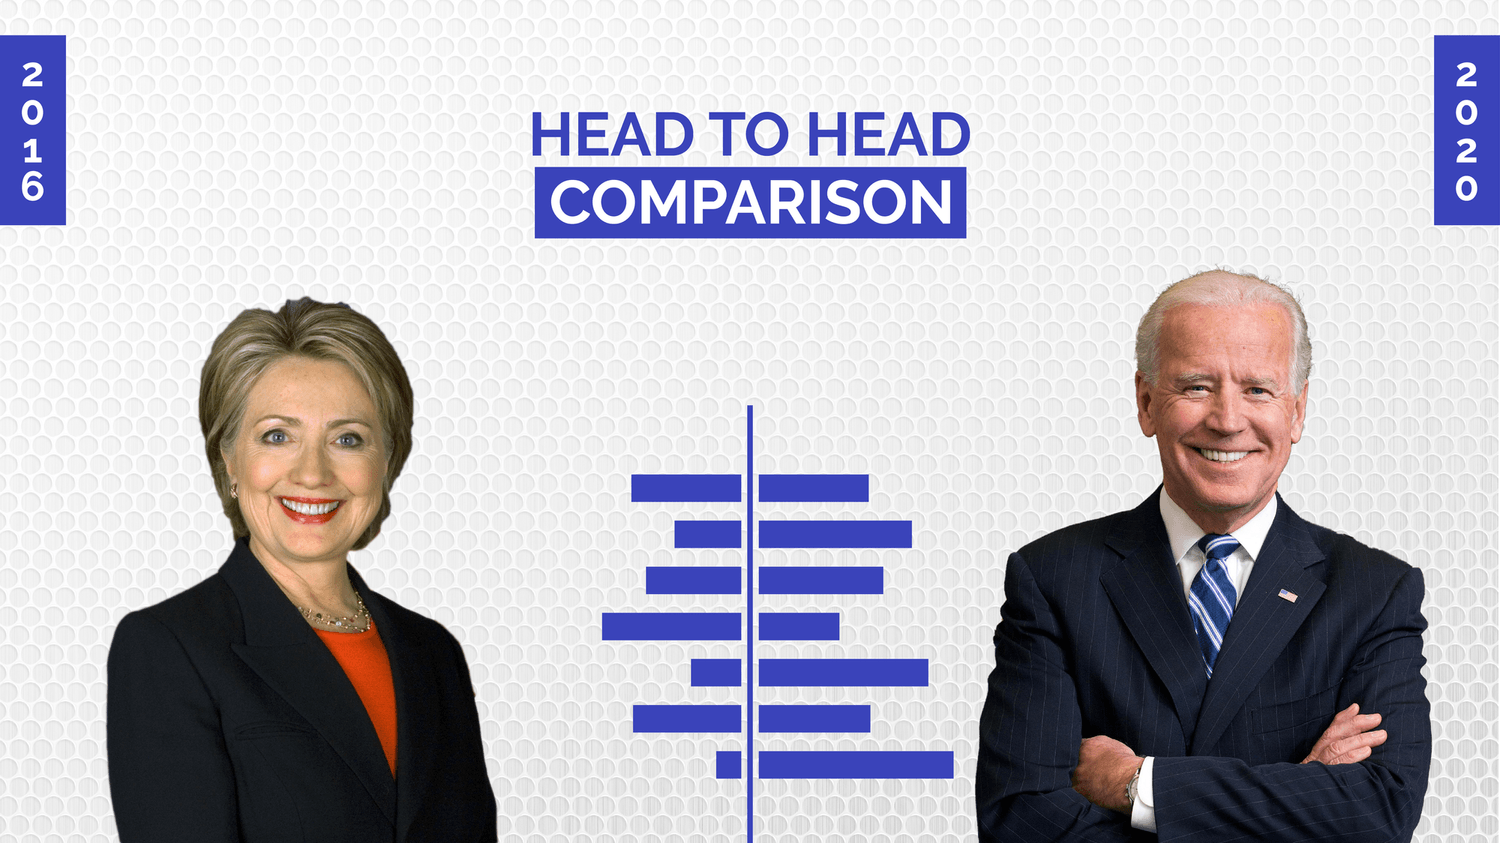
2016 Hillary Clinton Vs 2020 Joe Biden Primary Head to Head Comparison
Vice President Joe Biden performed better than Mrs. Hillary Clinton in 26 states by 3.5M (3,547,572) votes, getting 10.8M (10,811,171) over 7.3M (7,263,599) which is a 32% increase. When taking all 39 states where these 2 candidates primary performance can be compared, V.P Biden, reduced his lead to 2.6M(2,572,056) getting 19M (19,102,132) to Mrs. Clintons 16.5M(16,530,076). -------------------------------------------------------------------------------- Percentage Difference State By St
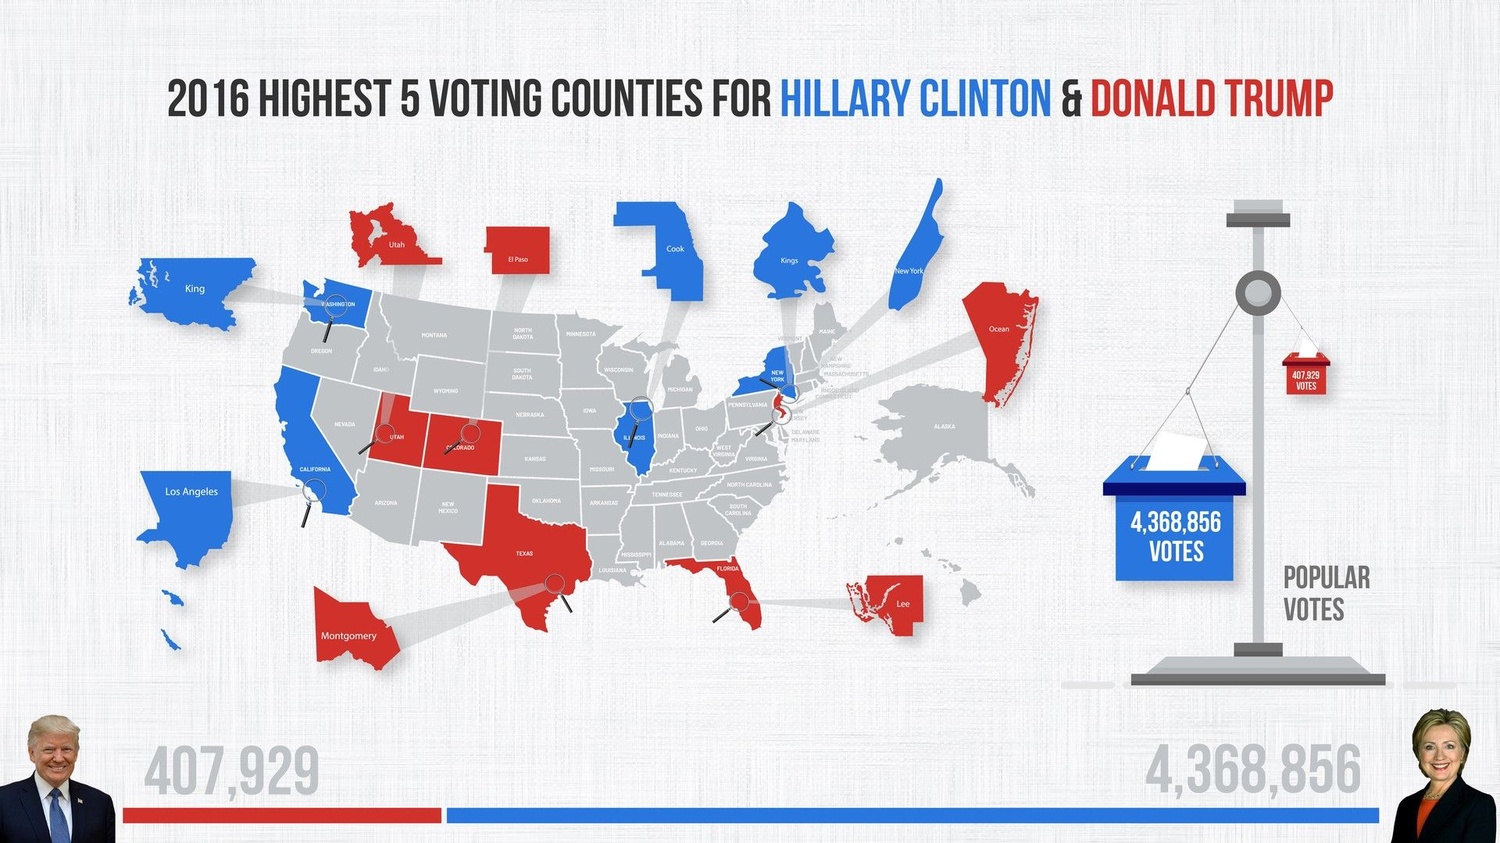
Top 5 popular vote generators counties for Donald Trump vs Hillary Clinton in 2016 General Elections
A comparison of the top 5 counties in the 2016 general elections with respect to its contribution towards their popular vote.

2018 Vermont General Election Story (Governor)
Phil Scott received 151.3k (55.4 %) votes, beating Christine Hallquist who gained 110.3k (40.4 %) by 40.9k votes in Vermont.

2018 Maine General Election Story (Governor)
Janet Mills received 321k (50.9 %) votes, beating Shawn Moody who gained 272.3k (43.2 %) by 48.7k votes in Maine.

2018 Colorado General Election Story (Governor)
Jared Polis received 1.3M (53.4 %) votes, beating Walker Stapleton who gained 1.1M (42.8 %) by 268.1k votes in Colorado.

2018 Connecticut General Election Story (Governor)
Ned Lamont received 694.5k (49.4 %) votes, beating Bob Stefanowski who gained 650.1k (46.2 %) by 44.4k votes in Connecticut.

